We used an integrated modelling framework for our analysis. For building the economic-environmental-health modelling framework, we combined a detailed economic representation of agricultural subsidies11 with region and commodity-specific environmental footprints5, and with a health assessment of the burden of diet-related diseases that are associated with dietary risk factors, such as low intake of fruits and vegetables, and high intake of red meat12 (“Methods”). In our environmental analysis, we focus on changes in agricultural GHG emissions (specifically methane and nitrous oxide) because GHG emissions, compared to other environmental impacts, are less modifiable by farm-level management and more by changes in the mix of production5. Within the framework, we account for the dynamic interactions that e.g. changes in diet-related diseases have on the labour force and thus on economic output, and how price and supply-demand reactions influence production, consumption, trade, and the distribution of environmental impacts.
We used the modelling framework to analyse various options for reforming agricultural subsidies in line with health and climate-change objectives. The options we considered ranged from a complete removal of subsidies; over partial and complete coupling of subsidies to food commodities with beneficial environmental and health characteristics; to structural changes in the global subsidy scheme that, in addition to the repurposing of subsidies, included a more equal provision of subsidies across countries. For the coupling of subsidies, we adopted a food-group approach and, in line with projections of the required food-system transformation for healthy and sustainable diets, redirected different proportions of subsidies to the production of horticultural commodities (fruits, vegetables, legumes, and nuts) that have been associated with beneficial health and environmental characteristics.
Our food-group focus on horticultural products can be seen as analogous to approaches that aim to condition subsidies explicitly to the actual health and environmental characteristics of food commodities. Life-cycle analyses indicate that the impacts of what type of food is grown far outweighs how it is grown, especially when comparing animal source foods with plant-based ones, and when comparing different foods within the same region13,14. Similarly, epidemiological studies indicate that non-starchy plant-based foods such as fruits, vegetables, legumes, and nuts are associated with reduced risks for various diet-related diseases, while other foods are either associated with increased risk (red and processed meat) or are seen as relatively risk neutral (poultry and dairy) compared to baseline diets4,15. Here we focus on these general health and environmental characteristics of horticultural foods, noting that additional differentiation might sometimes be appropriate.
Current subsidies
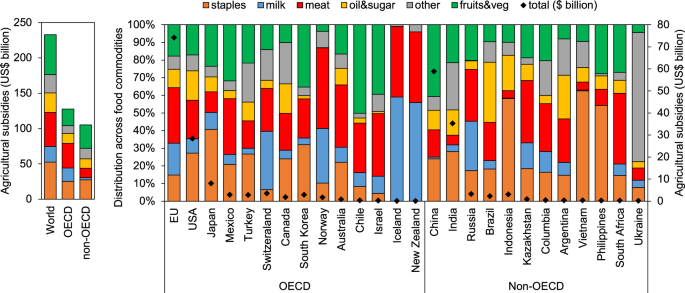
Agricultural support measures, excluding trade tariffs and subsidies, totalled USD 233 billion globally in 2017 (Table S9). More than half (55%) were spent by OECD countries, in particular the EU (32%), USA (12%), and Japan (3%), and much of the remainder (45%) by non-OECD countries, including China (25%) and India (15%). Globally, about 8% of all subsidies were directly coupled to a single output, and the remaining share benefited either special groups of commodities (29%), all commodities without differentiation (31%), or farmers directly without requiring production (31%). Analysed by final use, a fifth to a quarter of agricultural support measures were each used to grow staple crops (22%), meat products (22%), and fruits and vegetables (24%), and about a tenth each for milk and dairy (10%), oil and sugar (12%), and other crops (11%) (Fig. 1 and Supplementary Table 10).

Total subsidy payments for major spenders, grouped by OECD and non-OECD countries, are shown on the right axis and percentage distribution on the left axis.
Removal of subsidies
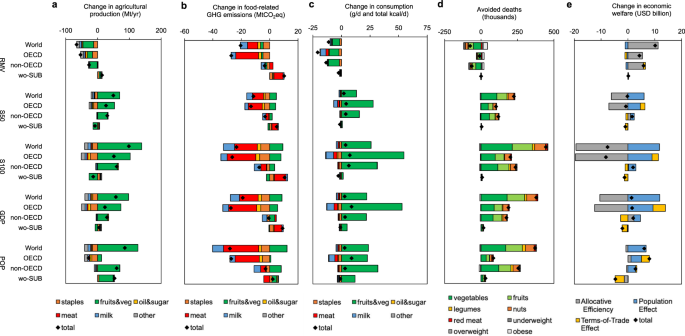
Removing all agricultural subsidies by 2030 led to reduced production of crops that were previously supported, including grains, fruits and vegetables, and oil seeds in OECD countries (−1.1 to −2.8% on average), and fruits, vegetables, and milk products in non-OECD countries (−0.8 to −1.2%) (Fig. 2a). Regions that had no subsidies to remove reacted by increasing production (+0.6%), but this did not compensate the reductions in other regions. GHG emissions mirrored the changes in production and were moderately reduced in OECD countries (−1.8%), slightly reduced in non-OECD countries (−0.1%), and slightly increased in non-subsidizing countries (+0.5%) (Fig. 2b). Individual countries exhibited larger changes (Supplementary Fig. 5).

The impacts include changes in food production (a), GHG emissions (b), food consumption (c), diet-related mortality (d), and economic welfare (e) by scenario, region, and component. Impacts are for the year 2030 compared to a business-as-usual scenario without reforms. The reform scenarios include a complete removal of agricultural subsidies (RMV), a repurposing of 50% (S50) and 100% (S100) of subsidies for the production of food commodities with beneficial health and environmental characteristics, and a combination of repurposing and regional restructuring in which each country provides subsidies in proportion to either its economy (GDP) or population (POP), whilst keeping the global amount of subsidy payments fixed. Regions include OECD countries with agricultural subsidies (OECD), non-OECD countries with agricultural subsidies (non-OECD), countries without agricultural subsidies (wo-SUB), and a combination of all countries (World). Food groups i
nclude wheat, and other cereals and grains (staples), vegetables, fruits, and other horticultural products (fruits&veg), vegetable oils and sugar (oil&sugar), beef, lamb, pork, and poultry (meat), milk and dairy products (milk), and other food commodities (other). Percentage changes and impacts for more specific regions and countries are presented in the Supplementary Information.
The changes in consumption followed the changes in production, but were mediated by changes in trade and commodity prices. The per-capita consumption of fruits, vegetables, and other horticultural products decreased in all regions (6 g/d, 1–9 g/d across regions), as did total energy intake (11 kcal/d, 2–21 kcal/d across regions) (Fig. 2c). Associated with those changes was a net increase in diet-related mortality (+75,000 deaths in 2030; 95% confidence interval (CI), 71,000−80,000), most of which was associated with the reductions in fruit and vegetable consumption in both OECD and non-OECD countries, but slightly compensated by reductions in overweight and obesity (Fig. 2d).
The increases in mortality affected the labour supply and led to a reduction in economic welfare (measured as equivalent variation in income) of about USD 1 billion (Fig. 2e). However, the reduction was overcompensated by increases in allocative efficiency associated with a more efficient use of labour outside of the previously subsidised agricultural sectors (USD 11 billion). In addition, changes in the terms of trade played a role for particular regions. For example, associated with the removal of subsidies were increases in world market prices, which decreased the gains from trade (i.e. the terms of trade) for net importing regions such as the OECD (USD 1.1 billion), and increased the terms of trade for net exporting regions. The net economic impact was positive for most regions.
Repurposing of subsidies
Using agricultural subsidies to support the production of foods with beneficial health and environmental characteristics (i.e. repurposing from previous ways of allocating subsidies, Fig. 1) led to increased production of horticultural products in OECD countries (+19% for complete repurposing) and non-OECD countries (+3%), and to slight reductions in non-subsidizing countries (−2.4%) (Fig. 2a). GHG emissions were moderately reduced in OECD countries (−1.7%) due to reductions in animal source foods and staple crops that accompanied the increases in horticultural products, they stayed similar in non-OECD countries (−0.2%) that had relatively less subsidies directed towards those crops, and they increased slightly in non-subsidising countries (+0.5%) as they partly compensated the reductions in animal source foods of other countries (Fig. 2b).
The consumption of fruits, vegetables, and other horticultural products increased significantly when all subsidies were repurposed (Fig. 2c). In OECD countries, fruit and vegetable consumption increased by 55 g/d (10%) on average, and in non-OECD countries by 31 g/d (5%). Consumption in non-subsidising countries also increased (2 g/d, 0.3%) as global increases in production reduced global market prices. The changes in consumption, in particular of fruits and vegetables, led to reductions in diet-related mortality that amounted to 444,000 (95% CI, 429,000−460,000) less deaths in 2030 in total, with a similar geographic distribution (Fig. 2d).
In the economic analysis, the reductions in diet-related mortality led to economic benefits associated with an increased labour supply (USD 12 billion) (Fig. 2e). However, the greater repurposing of subsidies to a specific agriculture sector also led to reductions in allocative efficiency, in particular in OECD countries (USD 20 billion). In non-OECD countries, the subsidies compensated taxes that are frequently levied on the horticultural sector, which resulted in small increases in allocative efficiency (USD 0.3 billion). The net effect on economic welfare was negative in the OECD under complete repurposing, but mildly positive in non-OECD countries. Repurposing half of the subsidies led to smaller reductions in allocative efficiency, and mitigated most of the net reductions in economic welfare in OECD countries, but also halved health benefits because of less labour-market gains.
Restructuring of subsidies
Combining a repurposing of subsidies with a restructuring in which each country provides subsidies in proportion to either its population or GDP, whilst keeping the global amount of subsidy payments fixed, led to increases in the production of fruits and vegetables that were more evenly distributed across regions, with particular large increases in countries without prior subsidies, especially in the population-based subsidy scenario (+4%) (Fig. 2a). Because of the global coverage of the sectoral incentives in this scenario, there were less production-based feedback effects, and overall GHG emissions were reduced similarly or more than in the repurposing scenarios (−0.3% in the GDP scenario, and −0.4% in the population scenario) (Fig. 2b).
The changes in consumption of horticultural products and the associated health impacts were also more equally distributed across regions, in particular in the population-based scenario (Fig. 2c). The increases in fruits and vegetables in previously non-subsidising countries were 12 g/d on average in that scenario (and 5 g/d in the GDP-based scenario), compared to 2 g/d in the repurposing-only scenario. The overall reductions in diet-related mortality were similar in magnitude as the repurposing-only scenario (370,00–379,00 avoided deaths in 2030) (Fig. 2d), but with a more equal distribution of per-capita reductions in mortality (0.2−0.8% in the population-based scenario and 0.1–1.4% in the GDP-based scenario, compared to 0.1–1.5% in the repurposing-only scenario; Supplementary Fig. 9).
Both variants of structural subsidy reform were associated with global increases in economic welfare (USD 1.8–5.5 billion), but regional impacts differed (Fig. 2e). As subsidies were reduced in OECD countries, the reductions in allocative efficiency decreased or turned positive, which led to net economic gains when combined with the gains from an increased labour force. The total level of subsidies stayed similar in non-OECD countries, with impacts similarly positive as in the repurposing-only scenario. However, subsidy payments increased and allocative efficiency decreased in previously non-subsidising countries, which was partly compensated by gains from an increased labour force. The losses could be fully compensated, at least in principle, by transfer payments from other regions as net gains there were twice as large as the net losses in previously non-subsidising countries.


